Airbnb Occupancy Rates: Top US Cities Guide
Airbnb occupancy rate is the percentage of nights a property is booked over a given period (monthly or annually). This metric is crucial for short-term rental success. For investors and hosts seeking maximum profitability, understanding which markets deliver the highest occupancy rates can mean the difference between a thriving rental business and a struggling investment.
This guide reveals the top cities with the highest Airbnb occupancy rates, analyzes the driving factors, and provides strategies to boost your property's performance. Whether you're considering your first short-term rental investment or optimizing existing properties, STR Cribs' data-driven approach can help you maximize occupancy rates and revenue.
Top Cities with Highest Airbnb Occupancy Rates
Recent AirDNA analysis of 2025-2026 data shows several cities consistently outperform national averages for short-term rental occupancy. The following markets demonstrate exceptional booking rates, maintaining occupancy levels above 75% year-round.
Gatlinburg, Tennessee
Gatlinburg is the gateway to Great Smoky Mountains National Park, America's most visited national park with over 12 million annual visitors. This mountain town offers year-round appeal through outdoor recreation, family attractions like Dollywood, and seasonal events like fall foliage tours and winter cabin retreats.
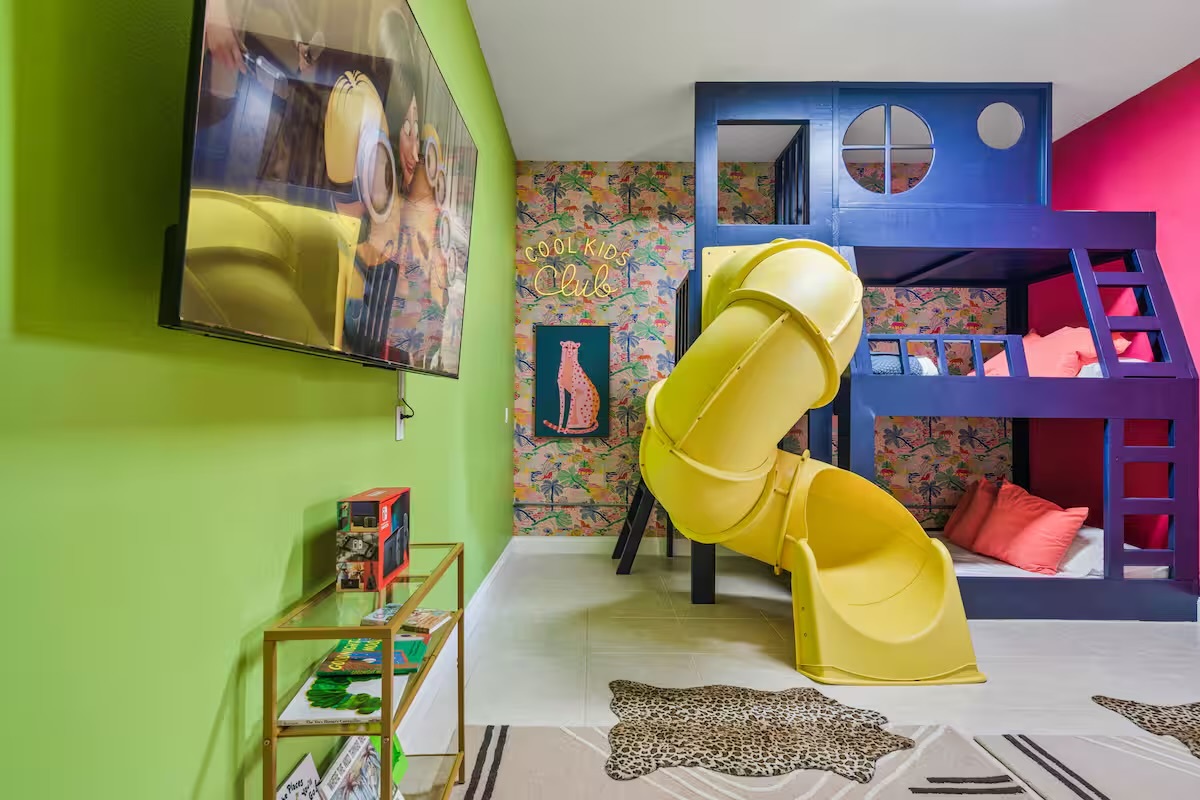
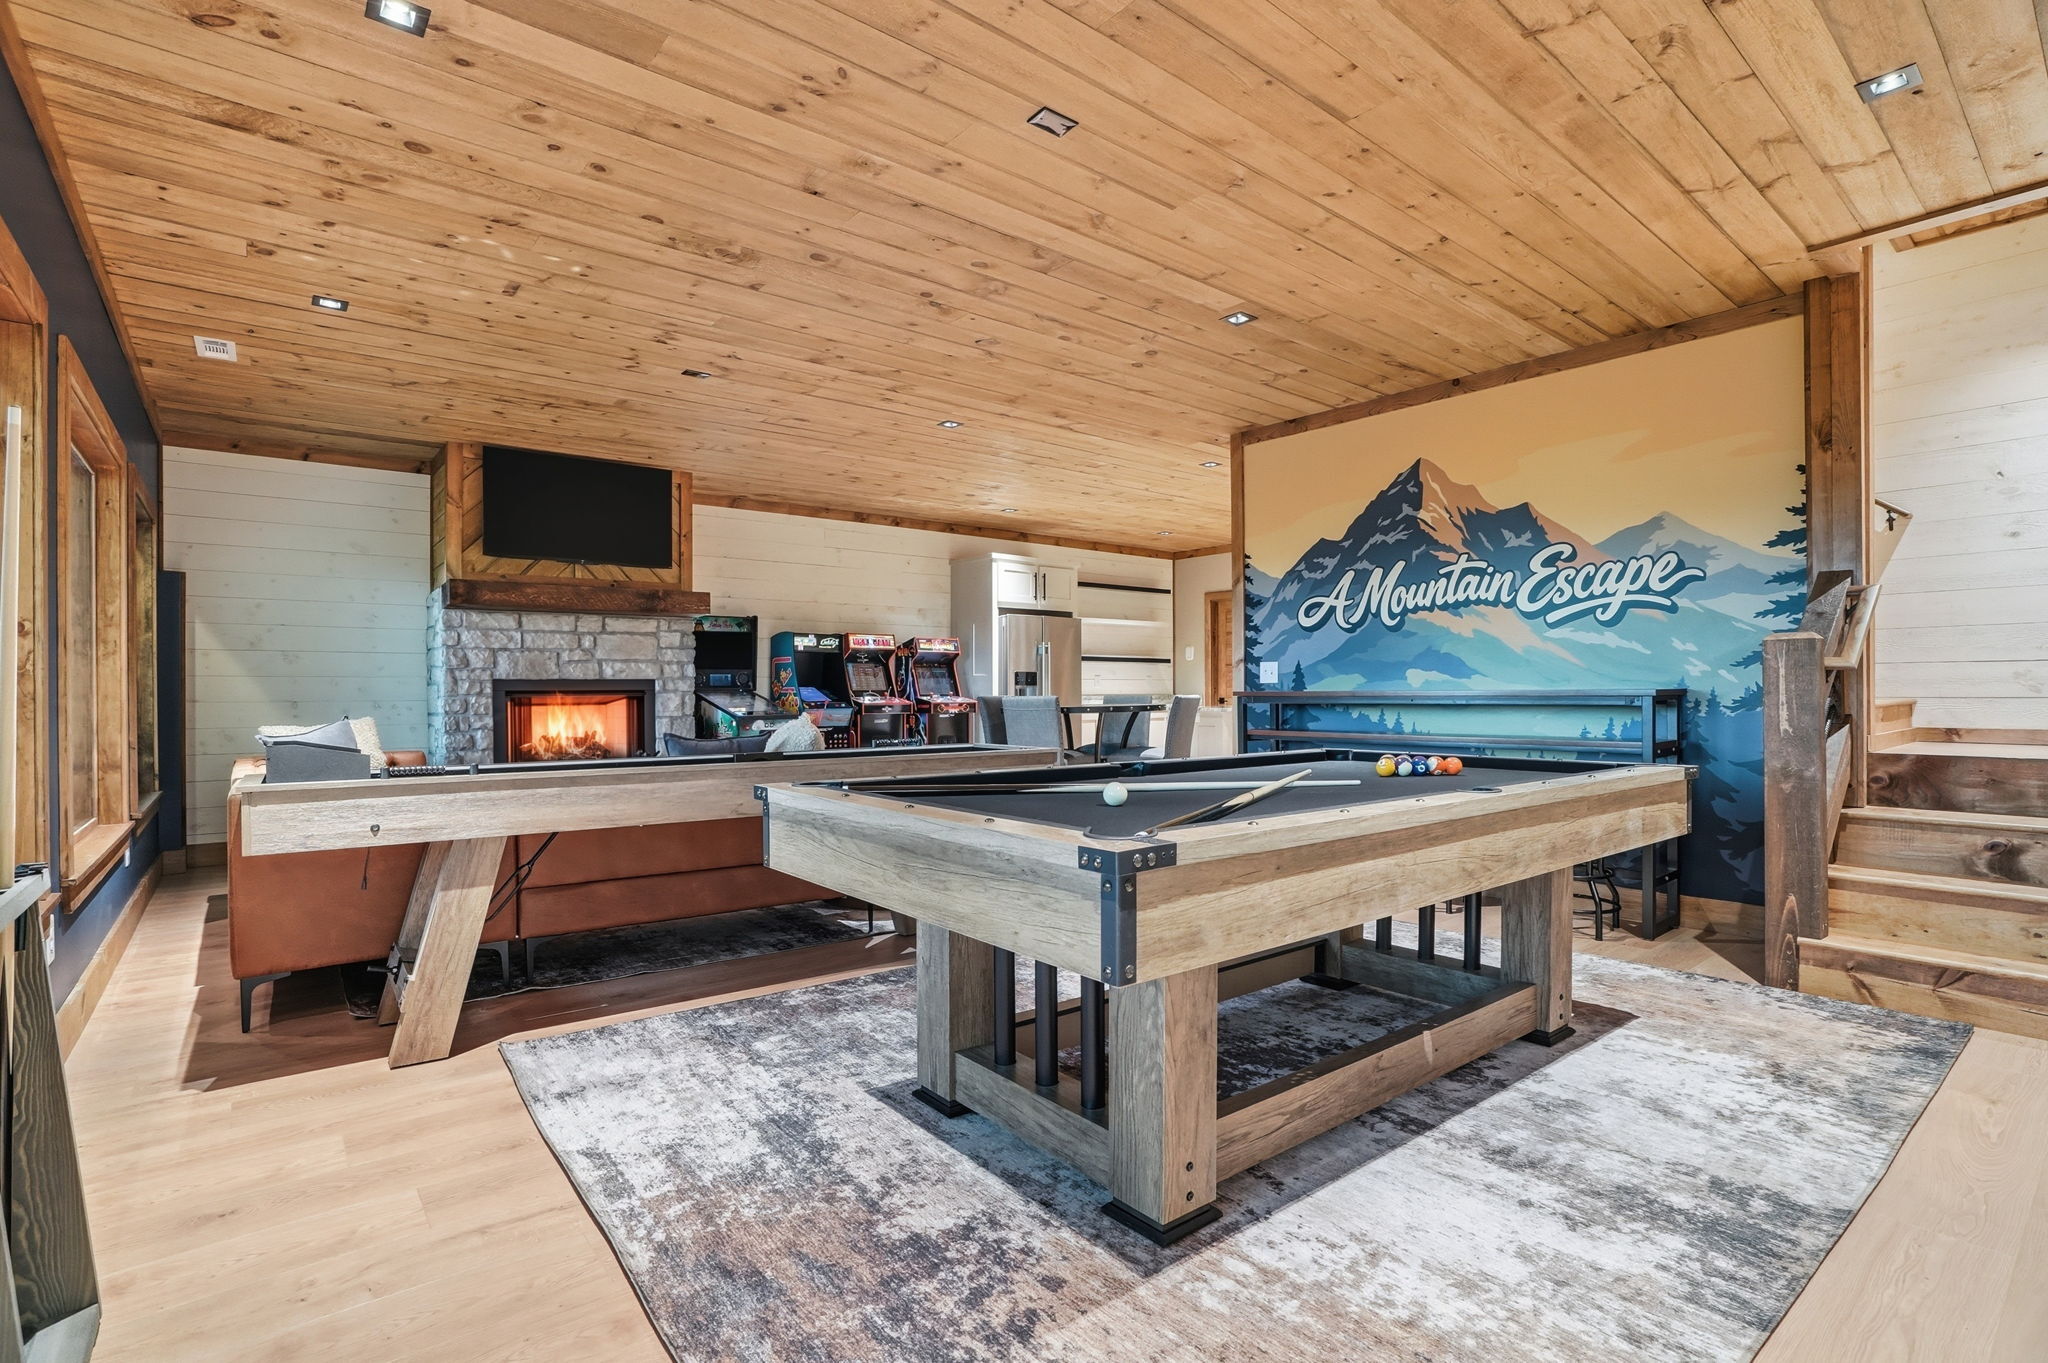
The market has an 82% average occupancy rate. Typical Average Daily Rates (ADR) range from $150-$300 depending on property size and amenities. Properties with mountain views, hot tubs, and game rooms command premium rates while maintaining high occupancy.
Gatlinburg's success stems from consistent year-round tourism, limited hotel inventory creating opportunities for short-term rentals, and the area's appeal to diverse demographics from families to couples. Tennessee's favorable tax environment and permissive short-term rental regulations support strong occupancy rates.
Savannah, Georgia
Savannah's historic charm, architecture, and cultural scene create year-round demand for short-term rentals. The Historic District, River Street, and trolley tours attract millions of visitors annually, while colleges and business travel provide consistent mid-week bookings.
Average occupancy rates reach 79%, with ADRs ranging from $120-$250 per night. The highest rates and occupancy levels are commanded by properties near the Historic District, while carriage house-style rentals and historic homes perform well.
Georgia's business-friendly environment for short-term rentals supports the market. The city's walkable layout and aesthetics appeal to millennial and Gen Z travelers.
Asheville, NC
Asheville combines mountain scenery with urban sophistication. It features craft breweries, arts districts, and outdoor recreation. The Blue Ridge Parkway, Biltmore Estate, and nearby national forests create strong leisure travel demand.
The market achieves 77% average occupancy with ADRs from $130-$280 per night. Unique properties like mountain cabins, downtown lofts, and artistic retreats maintain the highest booking rates, especially those with mountain views or brewery district access.
Asheville's occupancy success stems from its appeal to outdoor enthusiasts, cultural tourists, and food and beverage travelers. The city's "Beer City" reputation, mild year-round climate, and strong local tourism marketing contribute to consistent demand.
Key West, Florida
Key West's tropical atmosphere and unique location at the southernmost point of the continental U.S. create exceptional demand for vacation rentals. Consistent tourism is driven by Duval Street, sunset celebrations at Mallory Square, and water activities.
Occupancy rates average 81%, and premium ADRs of $200-$500 per night, reflecting the destination's luxury positioning. Waterfront properties, historic homes, and accommodations with pools or boat access achieve the highest metrics.
The island's limited land availability restricts supply growth while demand remains strong year-round due to the tropical climate and unique cultural attractions. However, strict local regulations require compliance for sustainable operations.
New Orleans, Louisiana
New Orleans offers cultural experiences through jazz, Creole cuisine, and historic architecture. The French Quarter, Garden District, and year-round festivals create consistent visitor demand beyond traditional tourist seasons.
Average occupancy reaches 76% with ADRs from $140-$350, spiking during events like Mardi Gras, Jazz Fest, and Sugar Bowl. French Quarter and nearby properties maintain premium rates and high occupancy through unique architecture and walkable access to attractions.
New Orleans' success factors include world-class dining and entertainment, frequent conventions and events, and the city's reputation as a "bucket list" destination. The permissive approach to short-term rentals in most neighborhoods supports market growth.
Palm Springs, California
Palm Springs attracts visitors with desert landscapes, mid-century modern architecture, and resort amenities. Its reputation as a celebrity retreat and LGBTQ+ friendly destination creates strong demand from diverse traveler segments.
Occupancy rates average 75% with seasonal variation, featuring ADRs from $180-$400 per night. Properties with pools, mountain views, and authentic mid-century design achieve premium performance, particularly during peak winter months when visitors escape colder climates.
The market benefits from consistent winter tourism, festival season including Coachella proximity, and year-round events. California's mature short-term rental market and Palm Springs' tourism-friendly policies support sustainable occupancy growth.
Factors Influencing Airbnb Occupancy Rates
Understanding the drivers behind high occupancy rates enables hosts and investors to make informed decisions about market selection and property optimization strategies.
Tourism and Demand
Tourism infrastructure and attractions underpin strong Airbnb occupancy rates. Markets with diverse attractions, multiple visitor segments, and established tourism marketing outperform areas reliant on single attractions or seasonal events. Cities offering both leisure and business travel opportunities maintain higher year-round occupancy through varied demand sources.
Seasonality
Occupancy rates fluctuate based on seasonal patterns. Beach destinations peak in summer, while ski markets excel in winter. Understanding local trends allows hosts to adjust pricing, plan maintenance during low seasons, and target marketing during shoulder periods. Markets with mild climates or diverse attractions maintain consistent occupancy.
Local Regulations
Municipal regulations impact occupancy potential through licensing, operational restrictions, and supply limitations. Cities with supportive short-term rental policies see higher occupancy rates due to professional property management and guest confidence in legal operations. Conversely, restrictive regulations can limit supply, potentially increasing occupancy for compliant properties while creating operational challenges.
Property Type and Amenities
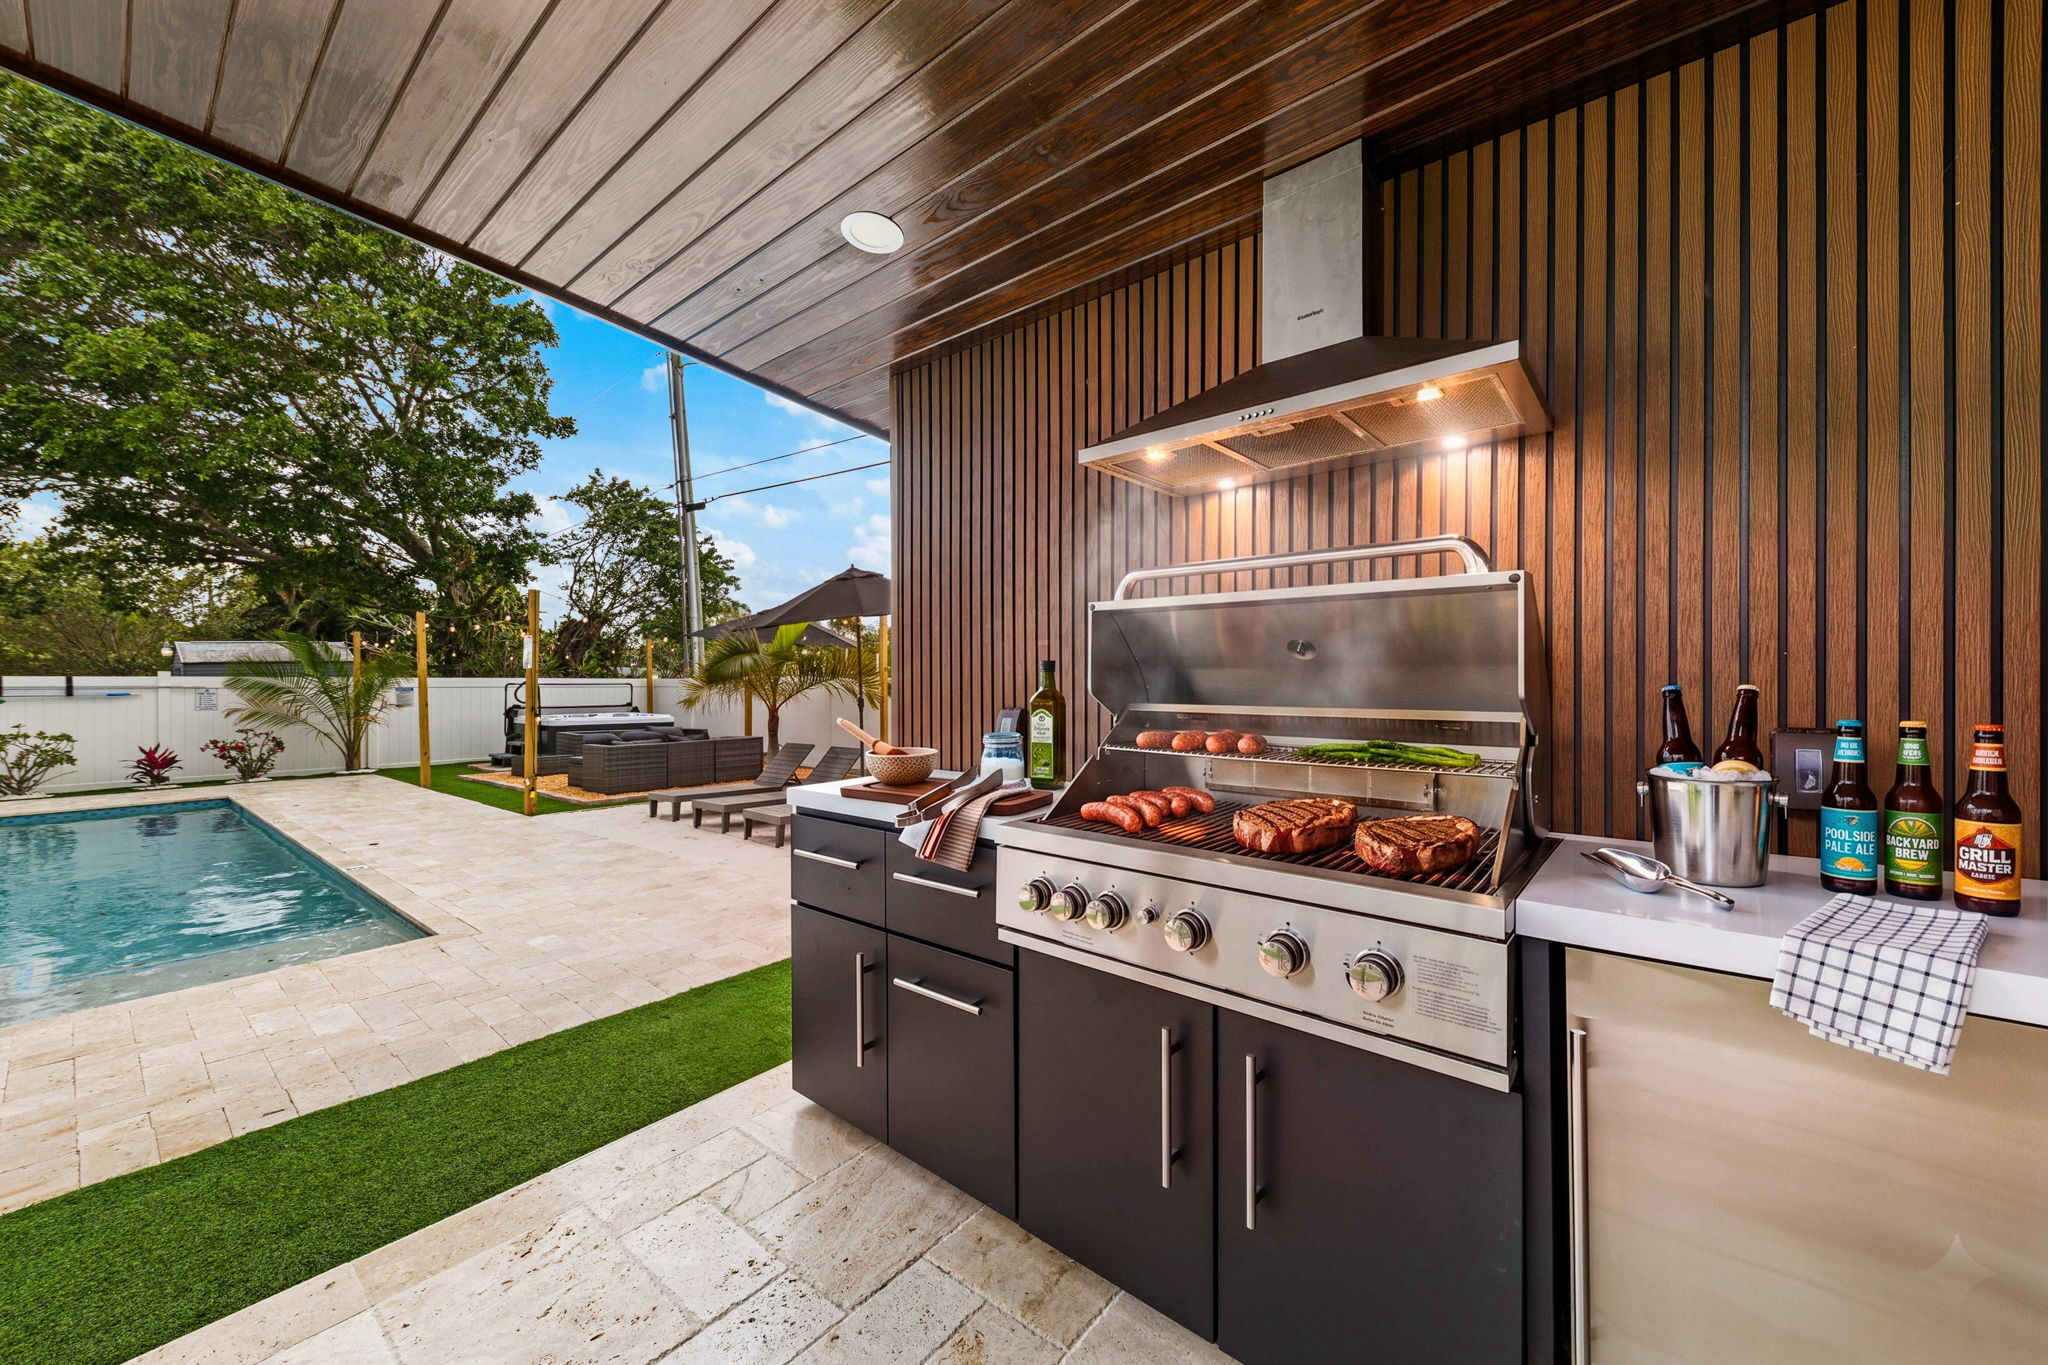
Entire homes have higher occupancy rates than private rooms due to guest preferences for privacy and space. Properties with unique amenities like pools, hot tubs, mountain views, or distinctive architecture command premium rates while maintaining strong bookings. Pet-friendly accommodations and family-oriented features expand target markets and improve occupancy in suitable locations.
Pricing Strategy
Dynamic pricing strategies that respond to demand fluctuations, local events, and seasonal patterns optimize occupancy and revenue. Competitive pricing research and automated tools maintain market positioning while maximizing booking rates. Properties priced appropriately for their market segment and amenities achieve optimal occupancy.
Seasonal Trends in Airbnb Occupancy
Understanding seasonal booking patterns enables strategic planning for maximum occupancy year-round. Most markets peak during summer (June-August) and holidays like Thanksgiving, Christmas, and Fourth of July.
Spring and fall shoulder seasons often provide sustained high occupancy with less competition, especially in mild climate markets or seasonal attractions like fall foliage. These periods may offer better profit margins through reduced competition and operational costs.
Low seasons present challenges but opportunities for hosts willing to adapt. Hosts willing to adapt strategies can take advantage of the opportunities low seasons present, despite the challenges. Offering extended stay discounts, targeting business travelers or local guests, and scheduling property improvements during low-demand periods can maintain year-round revenue.
Successful hosts use calendar management tools and historical booking data to predict seasonal trends and adjust availability, pricing, and marketing strategies. Understanding local event calendars and tourism patterns enables proactive positioning for maximum occupancy.
Impact of Local Regulations on Occupancy Rates
Local government policies significantly influence short-term rental market dynamics and occupancy potential. Cities with clear, supportive regulations see higher occupancy rates due to increased investor confidence and professional property management.
Restrictive markets like New York City and San Francisco have implemented strict limitations on short-term rentals, reducing legal supply and impacting occupancy patterns. While remaining legal properties may achieve higher occupancy due to limited competition, operational challenges and compliance costs create market entry barriers.
Before investing, research current and proposed regulations via city websites, local real estate professionals, and short-term rental advocacy organizations. Important regulatory factors include:
- Licensing requirements
- Occupancy limits
- Safety standards
- Tax obligations
Regulatory environments can change rapidly, making ongoing monitoring essential for sustainable operations. Cities are implementing registration systems, safety inspections, and operational requirements that impact startup costs and ongoing occupancy potential.
Comparison of Occupancy Rates by Property Type
Property type significantly influences occupancy potential and guest appeal across market segments. Entire homes consistently achieve the highest occupancy rates, typically 15-25% higher than private rooms in the same markets, due to guest preferences for privacy, space, and exclusive amenities.
Unique accommodations like cabins, converted barns, tiny houses, and architecturally distinctive properties often outperform standard apartments and condos through differentiated positioning and social media appeal. These properties command premium rates while maintaining strong occupancy through their distinctive character.
Guests increasingly expect standard amenities, which include:
- High-speed Wi-Fi
- Full kitchens
- Access to washer/dryer
- Dedicated parking
Properties with luxury amenities like pools, hot tubs, game rooms, or exceptional views can achieve occupancy rates 20-30% above market averages.
Location significantly impacts occupancy. Walkable neighborhoods, proximity to attractions, and scenic settings achieve higher booking rates than suburban or isolated properties.
Strategies to Improve Airbnb Occupancy Rates
Maximizing occupancy requires a strategic approach that combines pricing optimization, guest experience improvement, and property positioning. The following proven strategies help hosts achieve occupancy rates comparable to top-performing markets.
- Optimize Pricing Strategy: Implement dynamic pricing tools that adjust rates based on demand patterns, local events, and competitive positioning. Research comparable properties weekly and adjust pricing to maintain competitive advantage while maximizing revenue per available night.
- Improve Your Listing Quality: Invest in professional photography that presents your property's best features and unique amenities. Write detailed, accurate descriptions that mention local attractions and guest benefits. Update photos seasonally and refresh listing copy to maintain search algorithm performance.
- Provide Exceptional Customer Service: Respond to inquiries within one hour when possible and maintain proactive communication throughout the guest experience. Address issues immediately and exceed expectations through thoughtful amenities and local recommendations. Positive reviews directly correlate with improved occupancy rates.
- Offer Strategic Amenities: Research your target guest demographics and provide amenities that create value for your specific market. Business travelers prioritize Wi-Fi and workspaces, while families value safety features and entertainment options. Pool access, hot tubs, and outdoor spaces particularly drive bookings in vacation markets.
- Target Specific Guest Niches: Tailor your property and marketing to attract specific traveler segments like couples, families, business travelers, or pet owners. Specialized positioning can improve occupancy by appealing strongly to defined demographics rather than competing broadly.
- Leverage Social Media Marketing: Create engaging content that presents your property and local area across Instagram, Facebook, and TikTok platforms. User-generated content from satisfied guests provides authentic marketing that drives direct bookings and improves search visibility.
- Consider Data-Driven Design and Renovations: STR Cribs specializes in data-driven design and renovation services that maximize occupancy rates and revenue potential. Using market analysis and guest preference data, STR Cribs creates spaces specifically designed for short-term rental success, offering comprehensive solutions from design visualization and space planning to material selection and full-scale renovations.
STR Cribs operates nationwide (excluding Hawaii and Alaska) through vetted contractors and design professionals. Clients report up to 64% increases in occupancy rates, 40% higher average daily rates, and $50,000 annual revenue increases compared to comparable properties. Financing options up to $100,000 are available for qualified borrowers with 0% introductory rates.
- Focus on Guest Experience: Create memorable experiences through welcome amenities, local partnerships, and personalized touches that encourage positive reviews and repeat bookings. Small investments in guest experience yield significant occupancy improvements.
- Update Photos Regularly: Refresh listing photos seasonally and after property improvements to maintain visual appeal and search algorithm performance. High-quality, current photos impact booking conversion rates.
- Achieve Superhost Status: Maintain the performance standards for Airbnb Superhost designation, including high response rates, positive reviews, and booking acceptance rates. Superhost status improves search visibility and guest confidence, increasing occupancy by 10-20%.
- Monitor Competitor Performance: Research comparable properties to understand pricing, amenities, and guest feedback. Use insights to identify opportunities for differentiation and improvement in your property positioning.
Economic Impact of High Airbnb Occupancy Rates
High occupancy short-term rentals positively impact local economies through increased tourism spending, job creation, and tax revenue. Airbnb guests typically spend more on local restaurants, attractions, and retail than hotel visitors due to longer stays and integration into residential neighborhoods.
Short-term rentals support local employment through:
- Cleaning services
- Maintenance professionals
- Property managers
- Hospitality suppliers
Many markets see substantial job creation in supporting industries as STR markets mature and professionalize.
High occupancy markets may face challenges like increased housing costs in desirable neighborhoods and impacts on long-term rental availability. Successful markets implement balanced policies that capture economic benefits while addressing community concerns through zoning, taxation, and operational standards.
Responsible short-term rental management emphasizes community integration, noise management, and positive neighbor relationships to ensure sustainable long-term market growth and continued regulatory support.
Airbnb Occupancy Rates
Data-driven decision making separates successful short-term rental investors from those struggling. Reliable market data sources include:
- AirDNA
- STR Report
- Local tourism bureaus
- Destination marketing organizations
These sources provide insights into occupancy trends, pricing patterns, and market dynamics.
Important performance metrics to monitor include:
- Average occupancy rates
- Average daily rates (ADR)
- Revenue per available room (RevPAR)
- Booking lead times
Understanding these metrics enables informed decisions about pricing, marketing, and property improvements.
Successful hosts track their property’s performance against local market averages and comparable properties to identify optimization opportunities. Monthly analysis of booking patterns, guest demographics, and revenue trends enables strategic adjustments to improve occupancy over time.
Market data should inform major decisions like property acquisition, renovation investments, and operational strategies. Regular analysis helps hosts adapt to changing market conditions and maintain competitiveness.
FAQ
Q: How is Airbnb occupancy rate calculated?
A: To calculate the Airbnb occupancy rate, use the formula: (Nights booked ÷ Total available nights) × 100. If your property is booked 22 nights out of 30 available nights in a month, your occupancy rate would be 73%.
Q: How has the pandemic affected global Airbnb occupancy rates?
A: COVID-19 initially caused significant occupancy decline in 2020, with many markets seeing 40-60% decreases. However, recovery began in 2021 with domestic travel leading the rebound. By 2023, most markets exceeded pre-pandemic occupancy levels, with rural and outdoor destinations performing well.
Q: How do Airbnb and hotel occupancy rates compare?
A: Airbnb occupancy rates are usually 10-20% lower than comparable hotels due to larger supply and different booking patterns. However, top-performing Airbnb properties often exceed hotel occupancy rates in the same markets through superior guest experience and unique positioning.
Q: What is the ideal Airbnb occupancy rate?
A: While ideal rates vary by market, occupancy above 70% is considered strong performance. Premium markets may achieve 80-90% occupancy, while secondary markets target 60-75%. Focus on optimizing both occupancy and average daily rate for maximum revenue.
Conclusion
Cities with high Airbnb occupancy rates share common traits: strong tourism demand, supportive regulations, and year-round visitor appeal. Markets like Gatlinburg, Savannah, and Asheville show how strategic positioning and exceptional guest experiences create sustainable occupancy performance advantages.
Achieving high occupancy rates requires data-driven decision making, strategic property positioning, and continuous guest experience optimization. Whether you are entering the short-term rental market or seeking to improve performance, implementing proven strategies and leveraging professional services like STR Cribs can help you achieve occupancy rates comparable to top-performing markets nationwide.